Monitoring with auto-recovery
High availability is a critical component of your SaaS and it requires several measures to achieve high availability.
In general, Omnistrate provides full support for your control plane, data plane (aka application) infrastructure and automated L1 support for your data plane failures.
Control plane failures
We will monitor, detect and recover any failures in your control plane to give you a 99.99% SLA.
Data plane infrastructure failures
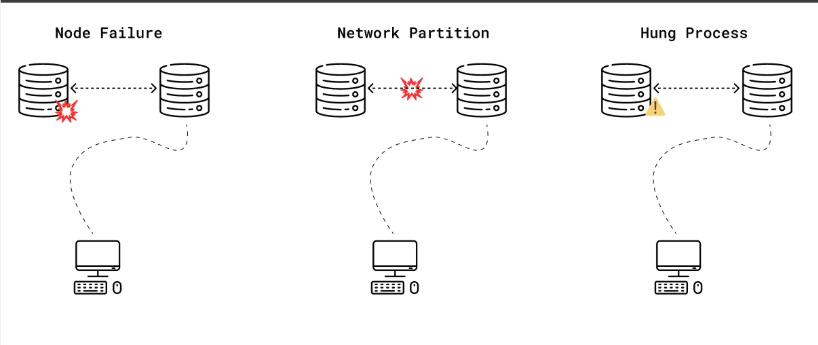
Omnistrate automatically detects the following failures and seamlessly recovers from them:
- Dead Process(es)
- Machine failures
- Network partitions
- Degraded storage
- Zonal failures
If we notice these failures, we try basic recovery mechanisms, ex - restart the process or machine or replacing the machine. If we can't recover, we will alert your team with the configured mechanism to look into it further.
Data plane non-infra issues
In addition, Omnistrate provides mechanisms for you to detect and recover from process failures using healthcheck actionhook.
In order to configure healthcheck actionhook, you can provide a check that we can use to validate the health of the process on a regular basis.
As an example, let's say you want to verify liveness for your database application. You can perform a read after write query and make sure database is making progress.
Note that you can specify different checks in the same healthcheck to make sure all components of your application are up and running. Let's say you also want to add a simple verification check to verify that your process is up and running, you can add a check using ps utility in addition to the above liveness check.
If your process health check is failing, we will alert your team with relevant details to look into it.
For more details on actionhooks, please see here
For more details on integrating with Operational tools like PagerDuty. To learn more about integrations, please see here
Understanding Healthy, Degraded, and Unhealthy
The health badge in Omnistrate reflects more than just whether a pod is in Running state.
- Healthy: Required platform checks, endpoint checks, and configured workload health signals are passing.
- Degraded: The instance is partially available, or one of the required health signals is failing while some of the workload is still up.
- Unhealthy: Required checks are failing and the instance is not considered operational.
Common reasons an instance can appear Degraded or Unhealthy even when pods are running:
- The customer-facing endpoint is not reachable yet
- A Kubernetes
Serviceor cloud load balancer is still pending - A custom healthcheck actionhook is failing
- A dependent integration or sidecar is failing
- The workload is running but not ready to serve traffic correctly
When these states occur, use the workflow view, instance details, and Debugging and Troubleshooting together rather than relying on pod phase alone.
Platform observability vs workload-specific monitoring stacks
Omnistrate provides platform observability for deployment cells and fleet operations, but that is different from any workload-specific monitoring stack your application may require.
If your chart or Operator expects components such as Prometheus Operator, Alertmanager, Grafana, or custom exporters to exist in the cluster, do not assume they are already present for your workload by default. Install and manage those cluster-level components at the deployment-cell layer by using Deployment Cell Amenities.
If you want Omnistrate dashboards to include your workload metrics, use Integrations to define scrape targets, modeled metrics, and dashboards.