Debugging and Troubleshooting
You can debug and troubleshoot deployments in Omnistrate by leveraging the tools and features described below. These capabilities provide you with detailed visibility into each step of the deployment process, enabling you to identify, diagnose, and resolve issues efficiently.
Debugging Tools Overview
Omnistrate provides debugging tools to help you diagnose and resolve deployment issues:
| Tool | Purpose | When to use |
|---|---|---|
| Debug Events | View real-time workflow progress and errors | First step — identify which stage failed |
| Instance Debug | Inspect rendered Helm values, Terraform operation history, and execution logs | After you know which resource failed and need resource-level detail |
| Debug Mode | Interact with ongoing Terraform deployments in real-time | Fix Terraform deployment artifacts without restarting |
Debug Events
Omnistrate's Debug Events feature provides real-time, detailed insights into your deployments, allowing you to quickly pinpoint and resolve issues by offering a transparent view of each operation's progress and status.
How Debug Events Works
For each instance operation—such as create, modify, upgrade, start, stop, or delete—Omnistrate launches a dedicated workflow to carry out the task. This workflow moves through several defined stages, including bootstrap, storage, network, compute, deployment, and monitoring. Within each stage, actions are tracked as individual debug events in chronological order, giving a precise view of each action's execution status. This structure enables you to monitor the workflow's progression step-by-step and quickly locate the root cause of any issues. 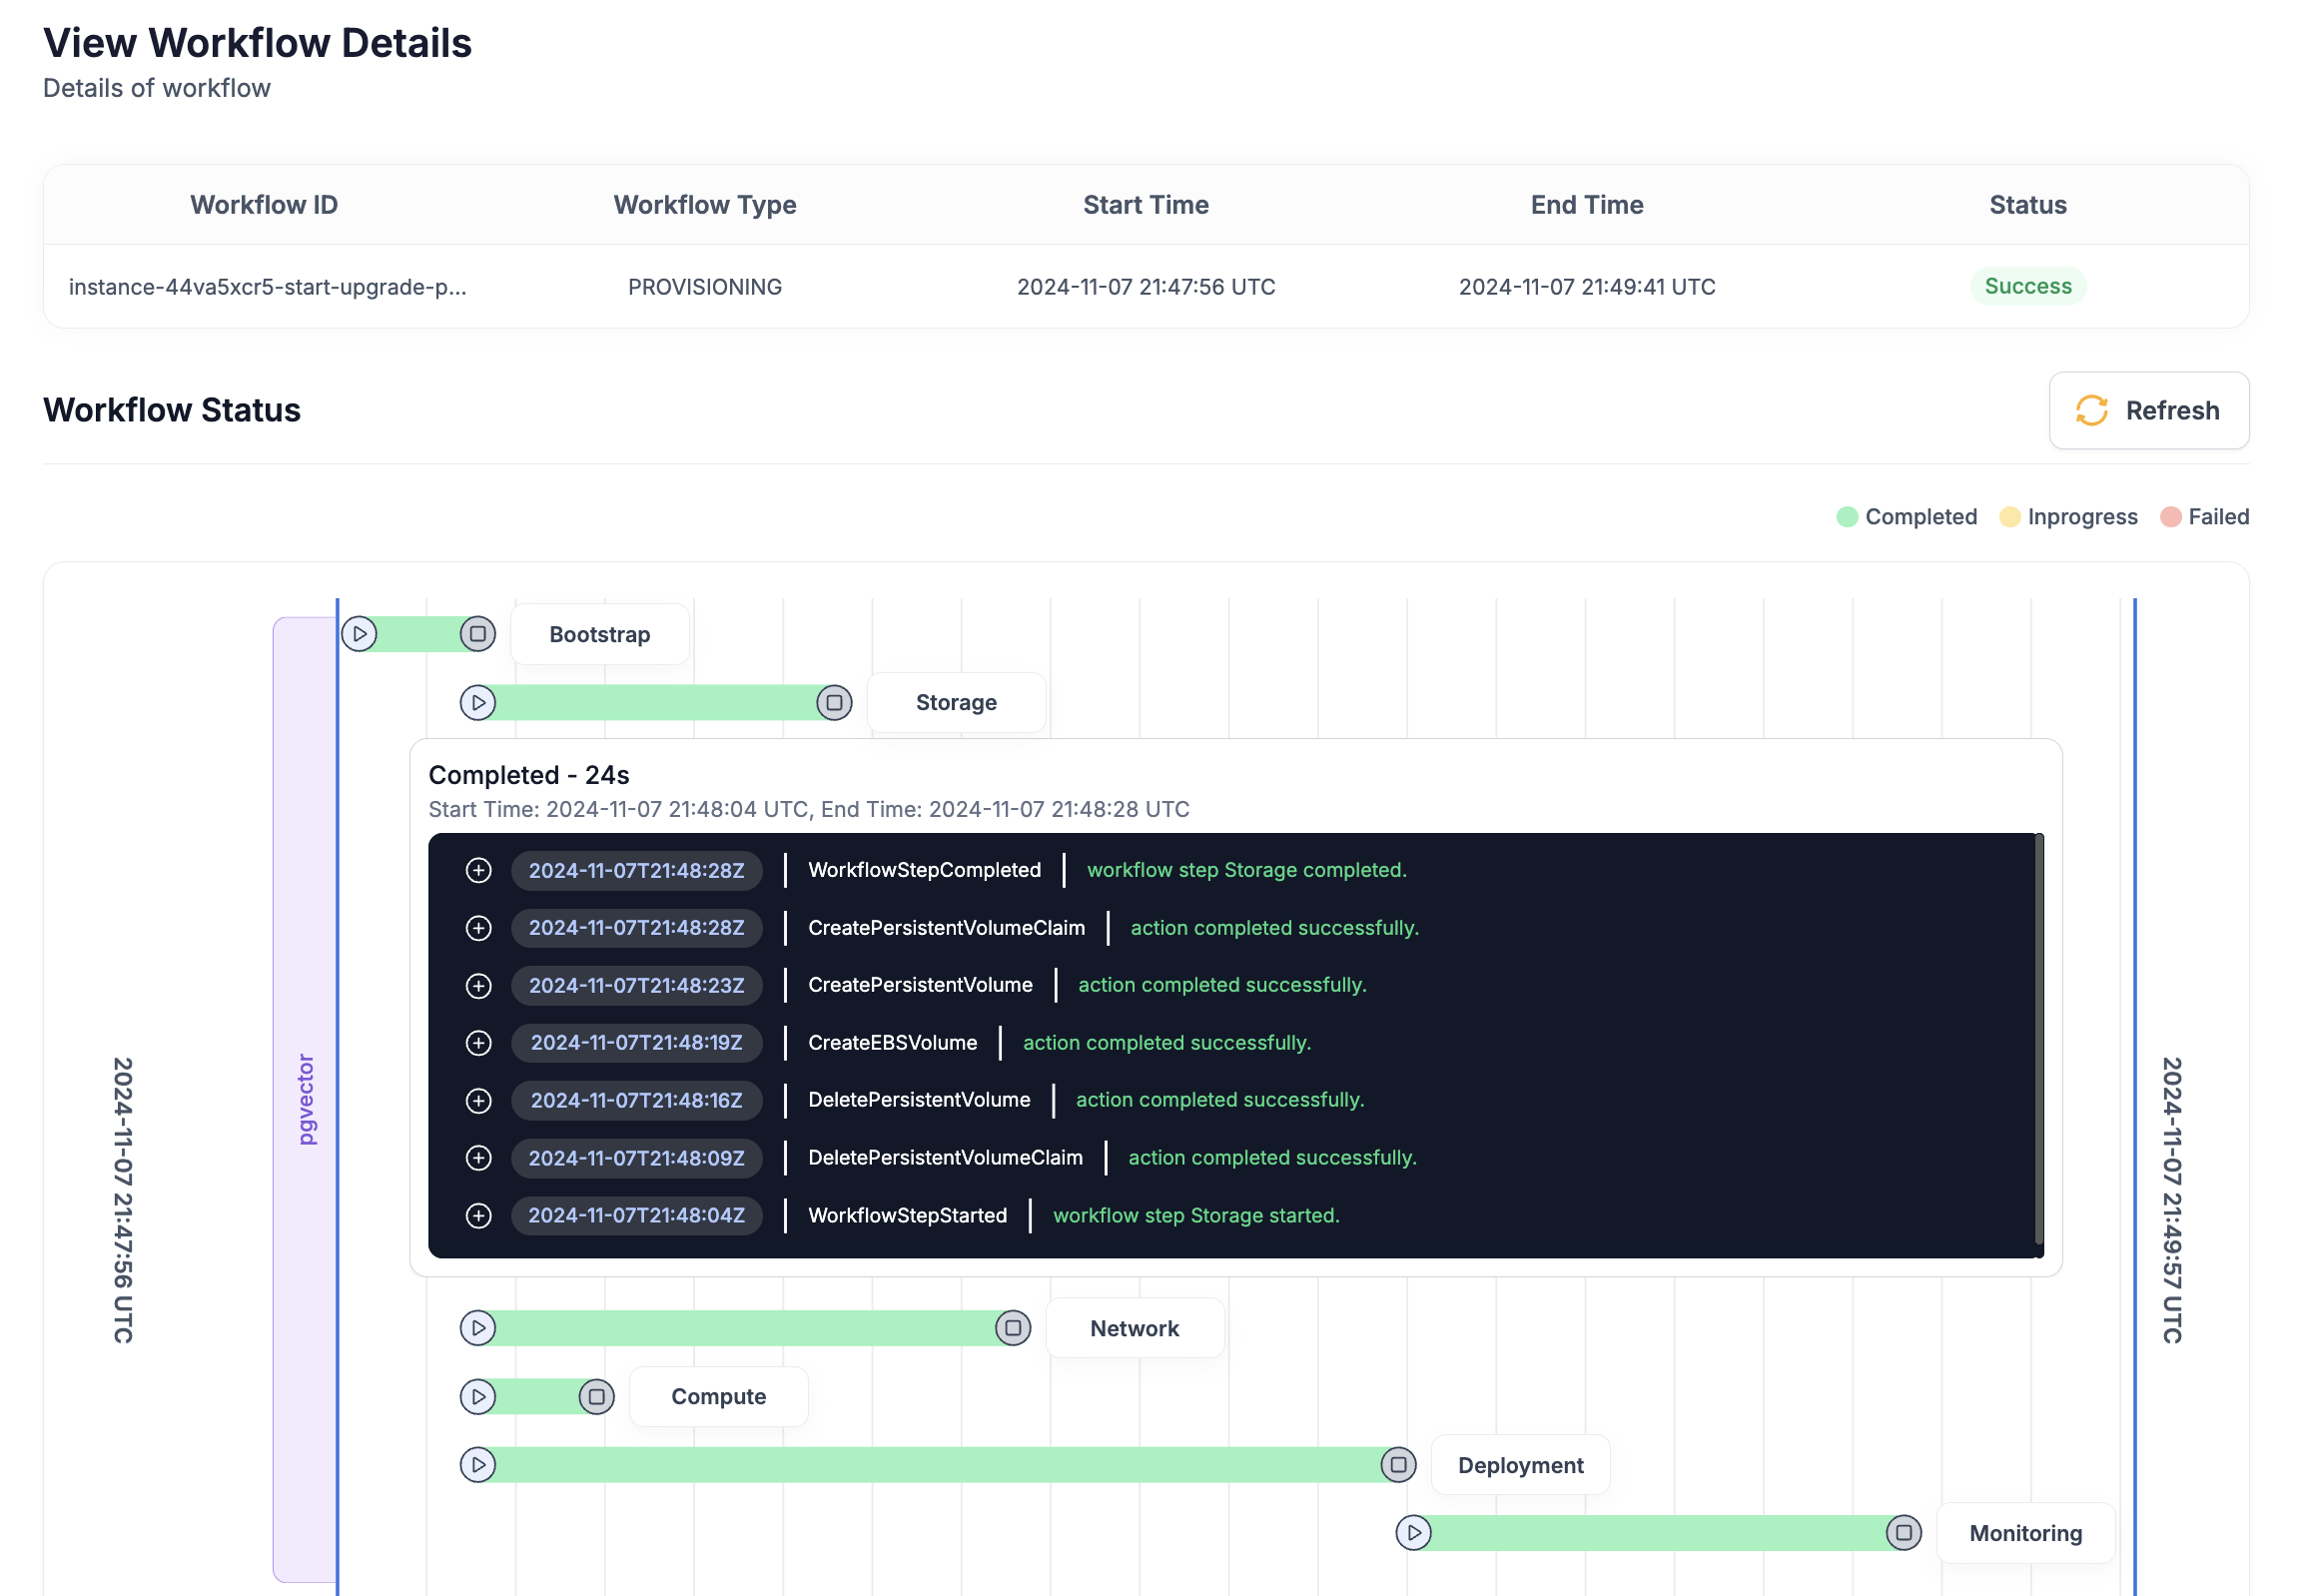
Debug Events Example Scenarios
When a workflow encounters an issue, such as an invalid instance type parameter, debug events identify the specific error within the workflow. This detailed view enables you to diagnose and resolve issues swiftly, ensuring minimal disruption.
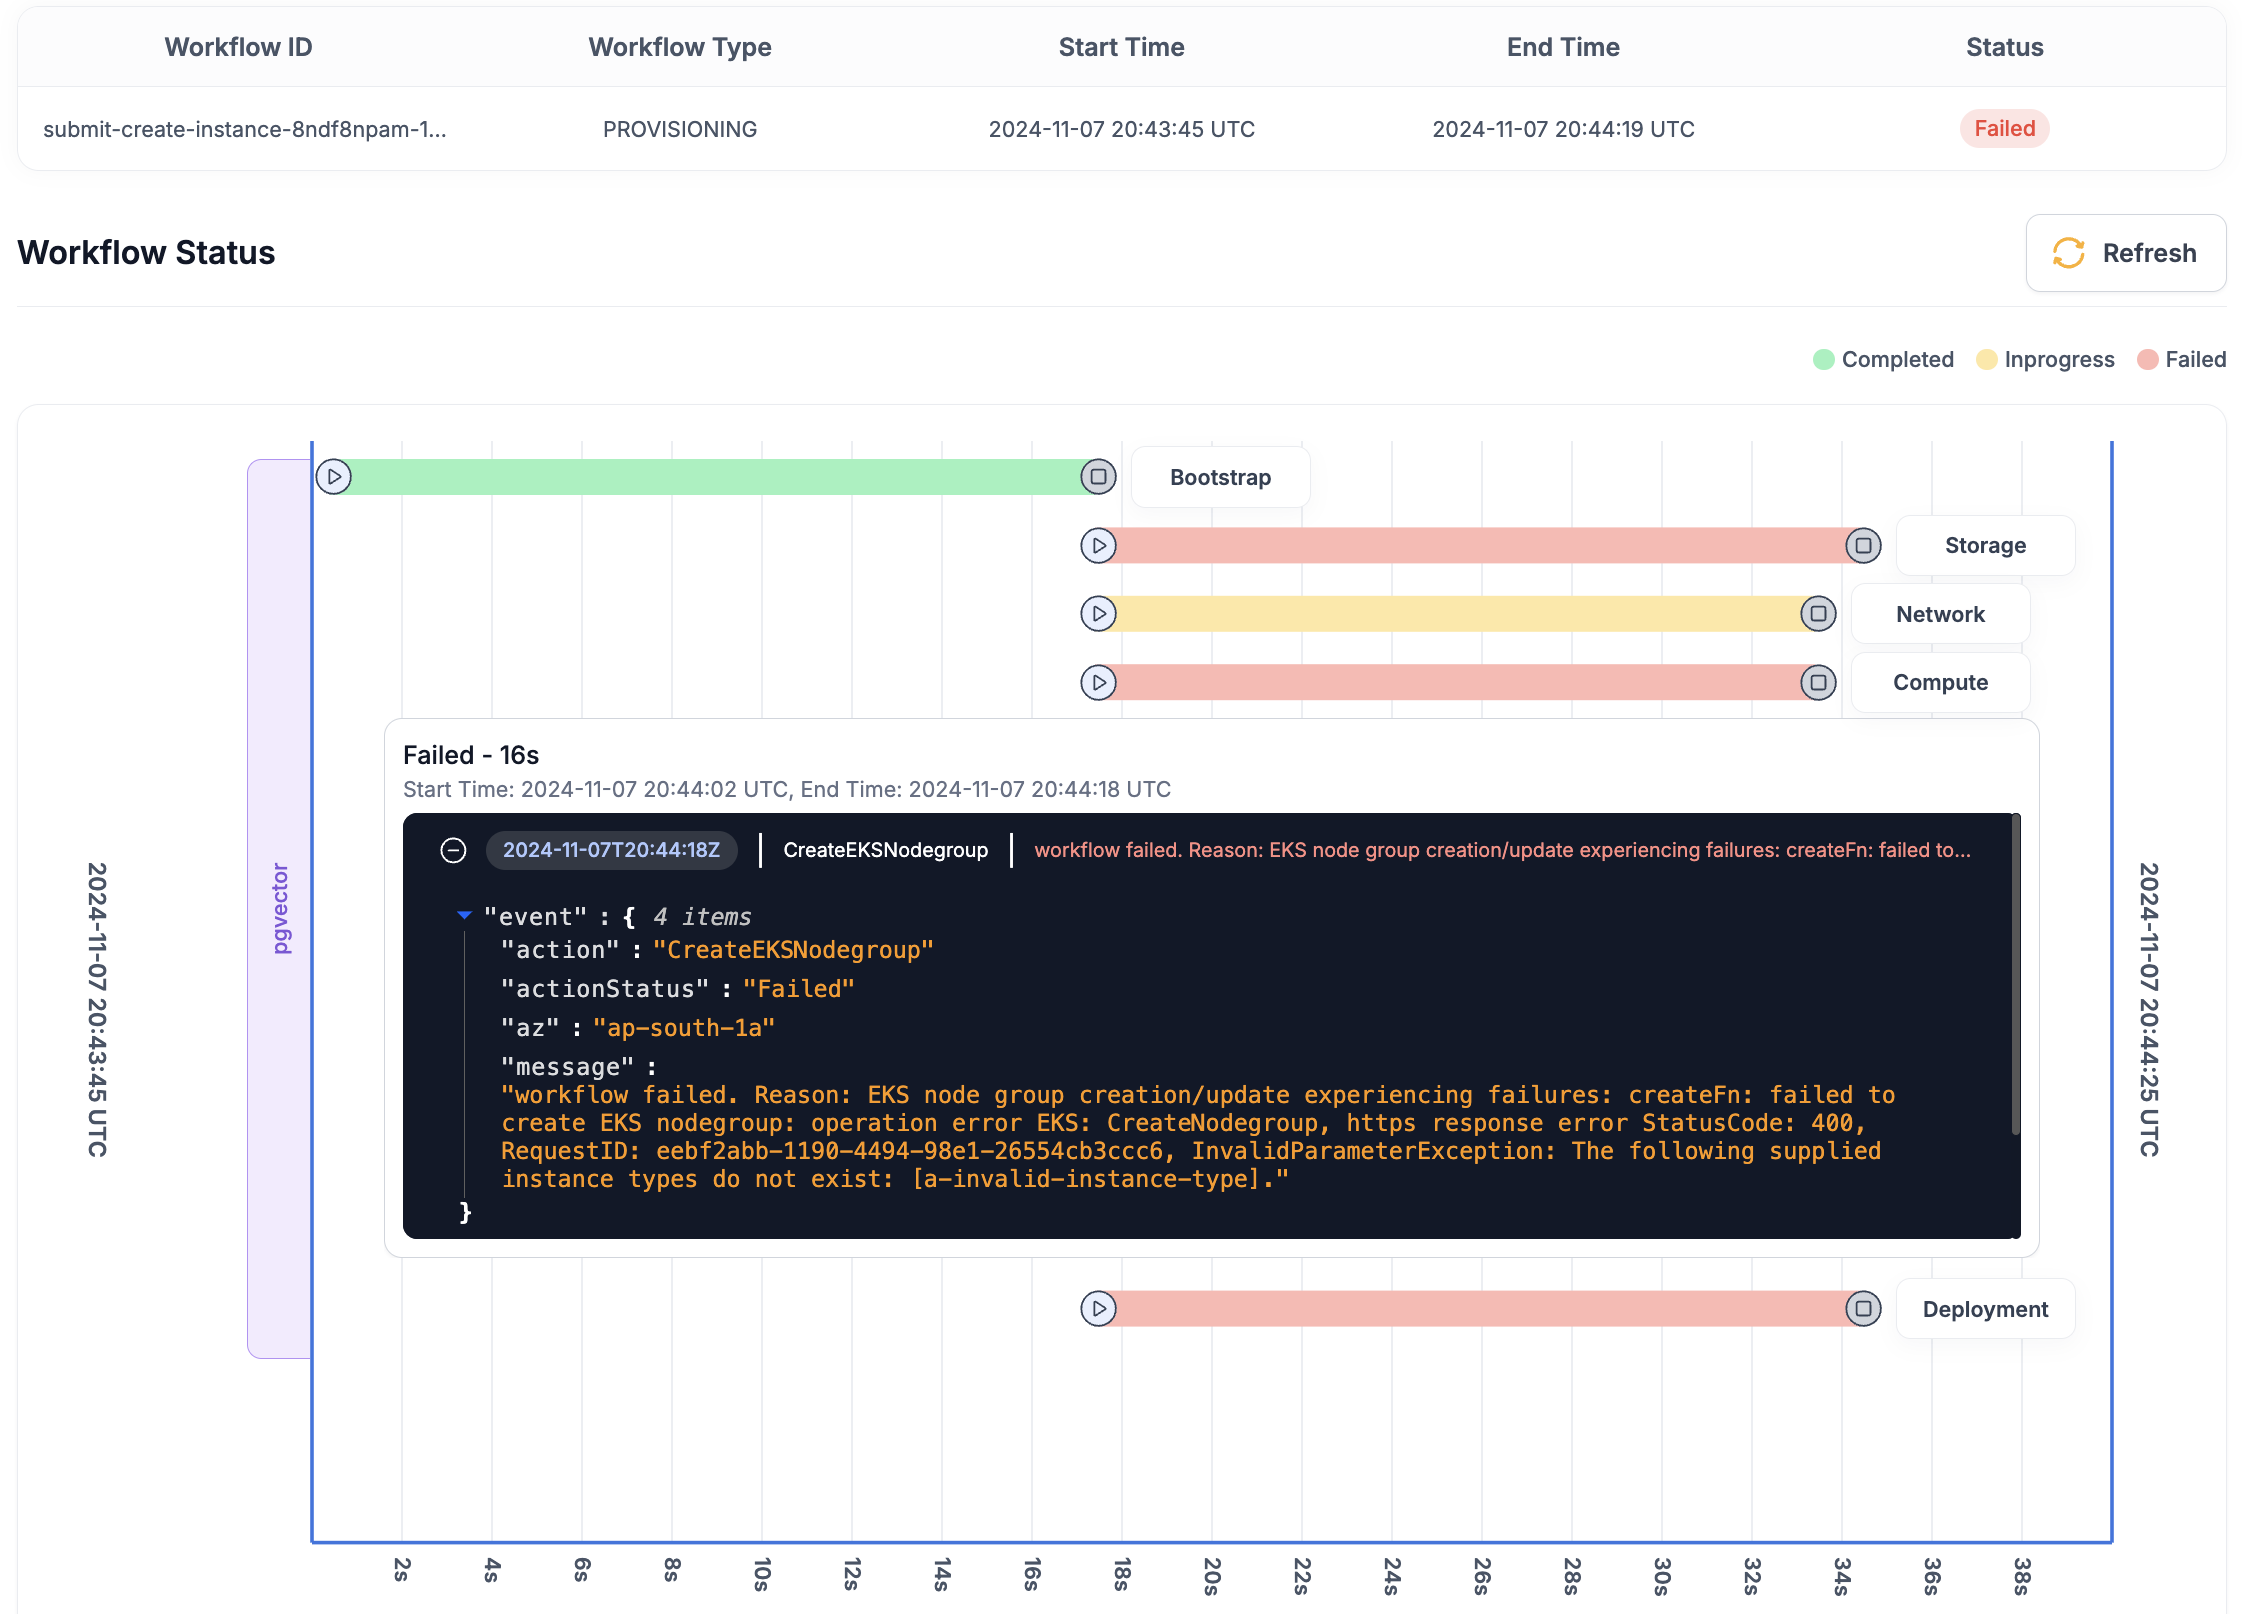
By utilizing Omnistrate's Debug Events, you can streamline issue resolution, improve operational efficiency, and ensure a smoother service experience.
Instance Debug
For most day-to-day Helm and Terraform troubleshooting, start with the instance debug view:
Use it to inspect the failing resource and review its operation history.
This is the primary place to look for:
- Rendered Helm values
- Helm client logs
- Rendered Terraform files for the last operation
- Terraform execution logs and apply failures
Which surface to trust
Use each surface for a different layer of the problem:
- Workflow view: orchestration context, stage transitions, and the high-level error captured by the workflow
- Instance debug: rendered Helm or Terraform artifacts and the last resource-level execution logs
- Live cluster or cloud state: final confirmation of what actually landed
If the workflow UI and instance debug disagree, use instance debug for resource-level failure details and use workflow events to understand which execution attempted them.
Omnistrate does not provide a separate manual terraform plan approval step before terraform apply. For Terraform-specific artifact capture and restart semantics, see From Terraform and Workflows.
If the failure is clearly isolated to a single resource, instance debug is usually faster than enabling full debug mode.
Helm troubleshooting checklist
For Helm-based services, most repeated failures fall into a small set of categories. Start with omnistrate-ctl instance debug <instance-id> and work through the following:
- Confirm the rendered chart values match what you expect.
- Read the Helm client logs for hook failures, timeouts, or Kubernetes API validation errors.
- Check whether
Jobs, hooks,Services, or load balancers are stuck in a pending state. - Look for leftover CRDs, finalizers, or namespaced resources if create or delete workflows keep failing.
- Revisit Helm runtime flags such as
wait,waitForJobs,skipCRDs,upgradeCRDs, andtimeoutNanosif the chart behavior does not match the release lifecycle you need.
For runtime flag details, see Helm Charts Runtime Configuration.
If you changed chart inputs or rendered artifacts, prefer publishing a new Plan version instead of repeatedly restarting the same workflow. See Workflows.
Debug Mode (Terraform Deployments)
Omnistrate's Debug Mode allows you to interact with ongoing Terraform deployments in real-time. This powerful feature enables you to quickly troubleshoot and fix issues in your Terraform scripts without restarting or upgrading your entire deployment from scratch. Debug Mode is ideal for testing complex Terraform deployment scripts or implementing urgent fixes while maintaining deployment continuity.

Prerequisites
Before using Debug Mode, ensure you have:
- Omnistrate CTL installed and authenticated. See Installing Omnistrate CTL.
- kubectl installed and configured.
- Access to the deployment cell where your instance is running. See Deployment Cell Access.
How Debug Mode Works
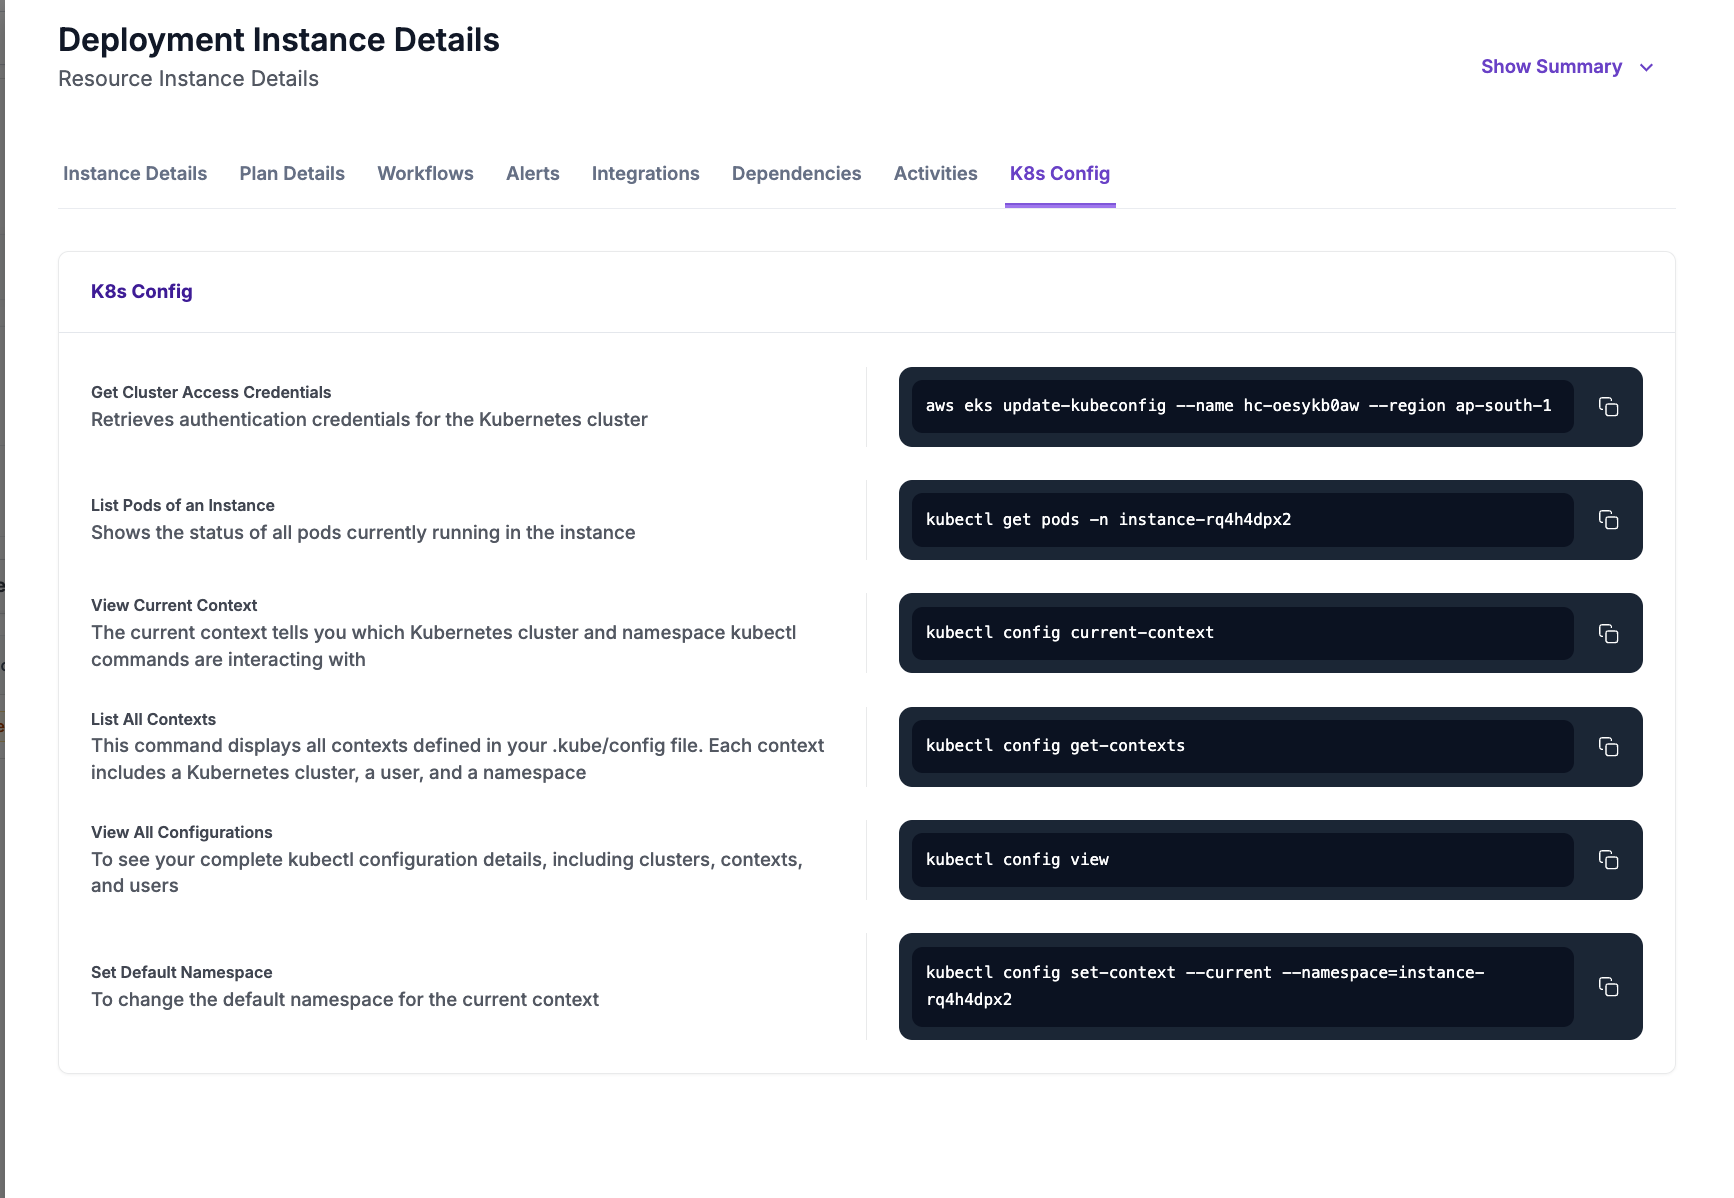
First, set up the proper Kubernetes context to your dataplane cluster, you can go to instance details page and see commands in K8s Config tab.
After context is properly setup, then run to access operational bastion:
kubectl -n dataplane-agent exec -it $(kubectl -n dataplane-agent get pods | grep dp-agent | awk '{print $1}' | head -1) -- /bin/bash
To enable debug mode for instance deployment:
Once debug mode is enabled, retrieve the current deployment artifacts:
omnistrate-ctl instance get-deployment <instance-id> --resource-name <resource-name> --output-path <path to workspace to save deployment artifacts>
Navigate to your workspace directory to review and modify the artifacts as needed.
Apply your modifications to the deployment:
omnistrate-ctl instance patch-deployment <instance-id> --resource-name <resource-name> --deployment-action apply --patch-files <path to workspace to save deployment artifacts>
When satisfied with your changes, resume the deployment workflow:
omnistrate-ctl instance continue-deployment <instance-id> --resource-name <resource-name> --deployment-action apply
The system will then continue with the deployment process, progressing through any remaining deployment steps.
Warning
Debug mode restricts instance operations to only delete and upgrade functions. After resuming deployment, you'll need to properly correct the Plan specification and upgrade your instance, then manually disable debug mode to restore all instance operations.
Next, fix the Plan spec and publish a new version. Then upgrade your instance to this updated version. After verifying that everything is functioning properly, disable debug mode to resume normal operations.
Debug Mode Example Scenarios
Taking terraform as an example, you may encounter a typo in your terraform deployment scripts causing the deployment to stall. By following the steps above, you can quickly fix these scripts without needing to restart the entire deployment process.
Once you've fixed your terraform artifacts locally and patched your changes, the Omnistrate platform applies the patch immediately without unnecessary retries. You can monitor terraform execution logs at /tmp/tf-<resource-id>-<instance-id>-log-output/resource-name>
You can continue to iterate and refine your terraform scripts in debug mode while maintaining the ongoing deployment. After resolving all issues and confirming your changes work as expected, simply continue to complete the deployment.
Warning
Don't forget to fix your main Plan spec and release a new version of it once you have proper artifacts been fixed. You will need to upgrade your instance to the correct version before you safely disable debug mode.